A vol-normalised momentum strategy that ranks the 50 most-traded Bybit perpetuals by 30-day risk-adjusted return, goes long the top-5 winners and short the bottom-5 losers. Extended to 4.75 years of history and stress-tested with Monte Carlo simulation.
XSMOM applies a classic cross-sectional momentum framework to crypto perpetuals, with two deliberate asymmetries: a trend-confirmation filter on the long side, and no filter on the short side.
In crypto, relative momentum persists over multi-week horizons: coins that have outperformed on a risk-adjusted basis tend to keep outperforming, and the weakest tend to keep underperforming. Ranking by vol-normalised return (return ÷ volatility) rather than raw return avoids buying high-volatility noise — a coin that rose 30% on 60% daily vol is a weaker signal than one that rose 20% on 15% vol.
The vol-normalised metric can rank a coin highly because its volatility collapsed, not because it's trending up. The long side therefore requires the coin to be above its moving average (MA-100 after optimisation) and have a positive raw 30-day return. The short side needs no filter: in a structurally risk-off altcoin regime, the weakest losers keep losing.
The full pipeline, from raw Bybit data to a ranked long/short book.
For each symbol, over the trailing 30 days ending at the rebalance date:
raw_return = (close[t] - close[t-30]) / close[t-30]
atr_pct = ATR(14) / close[t] # daily vol, as % of price
VNR = raw_return / (atr_pct × √30) # risk-adjusted momentum
VNR measures how far price moved per unit of volatility over the window — the standard "vol-normalised" momentum used in academic cross-sectional momentum studies.
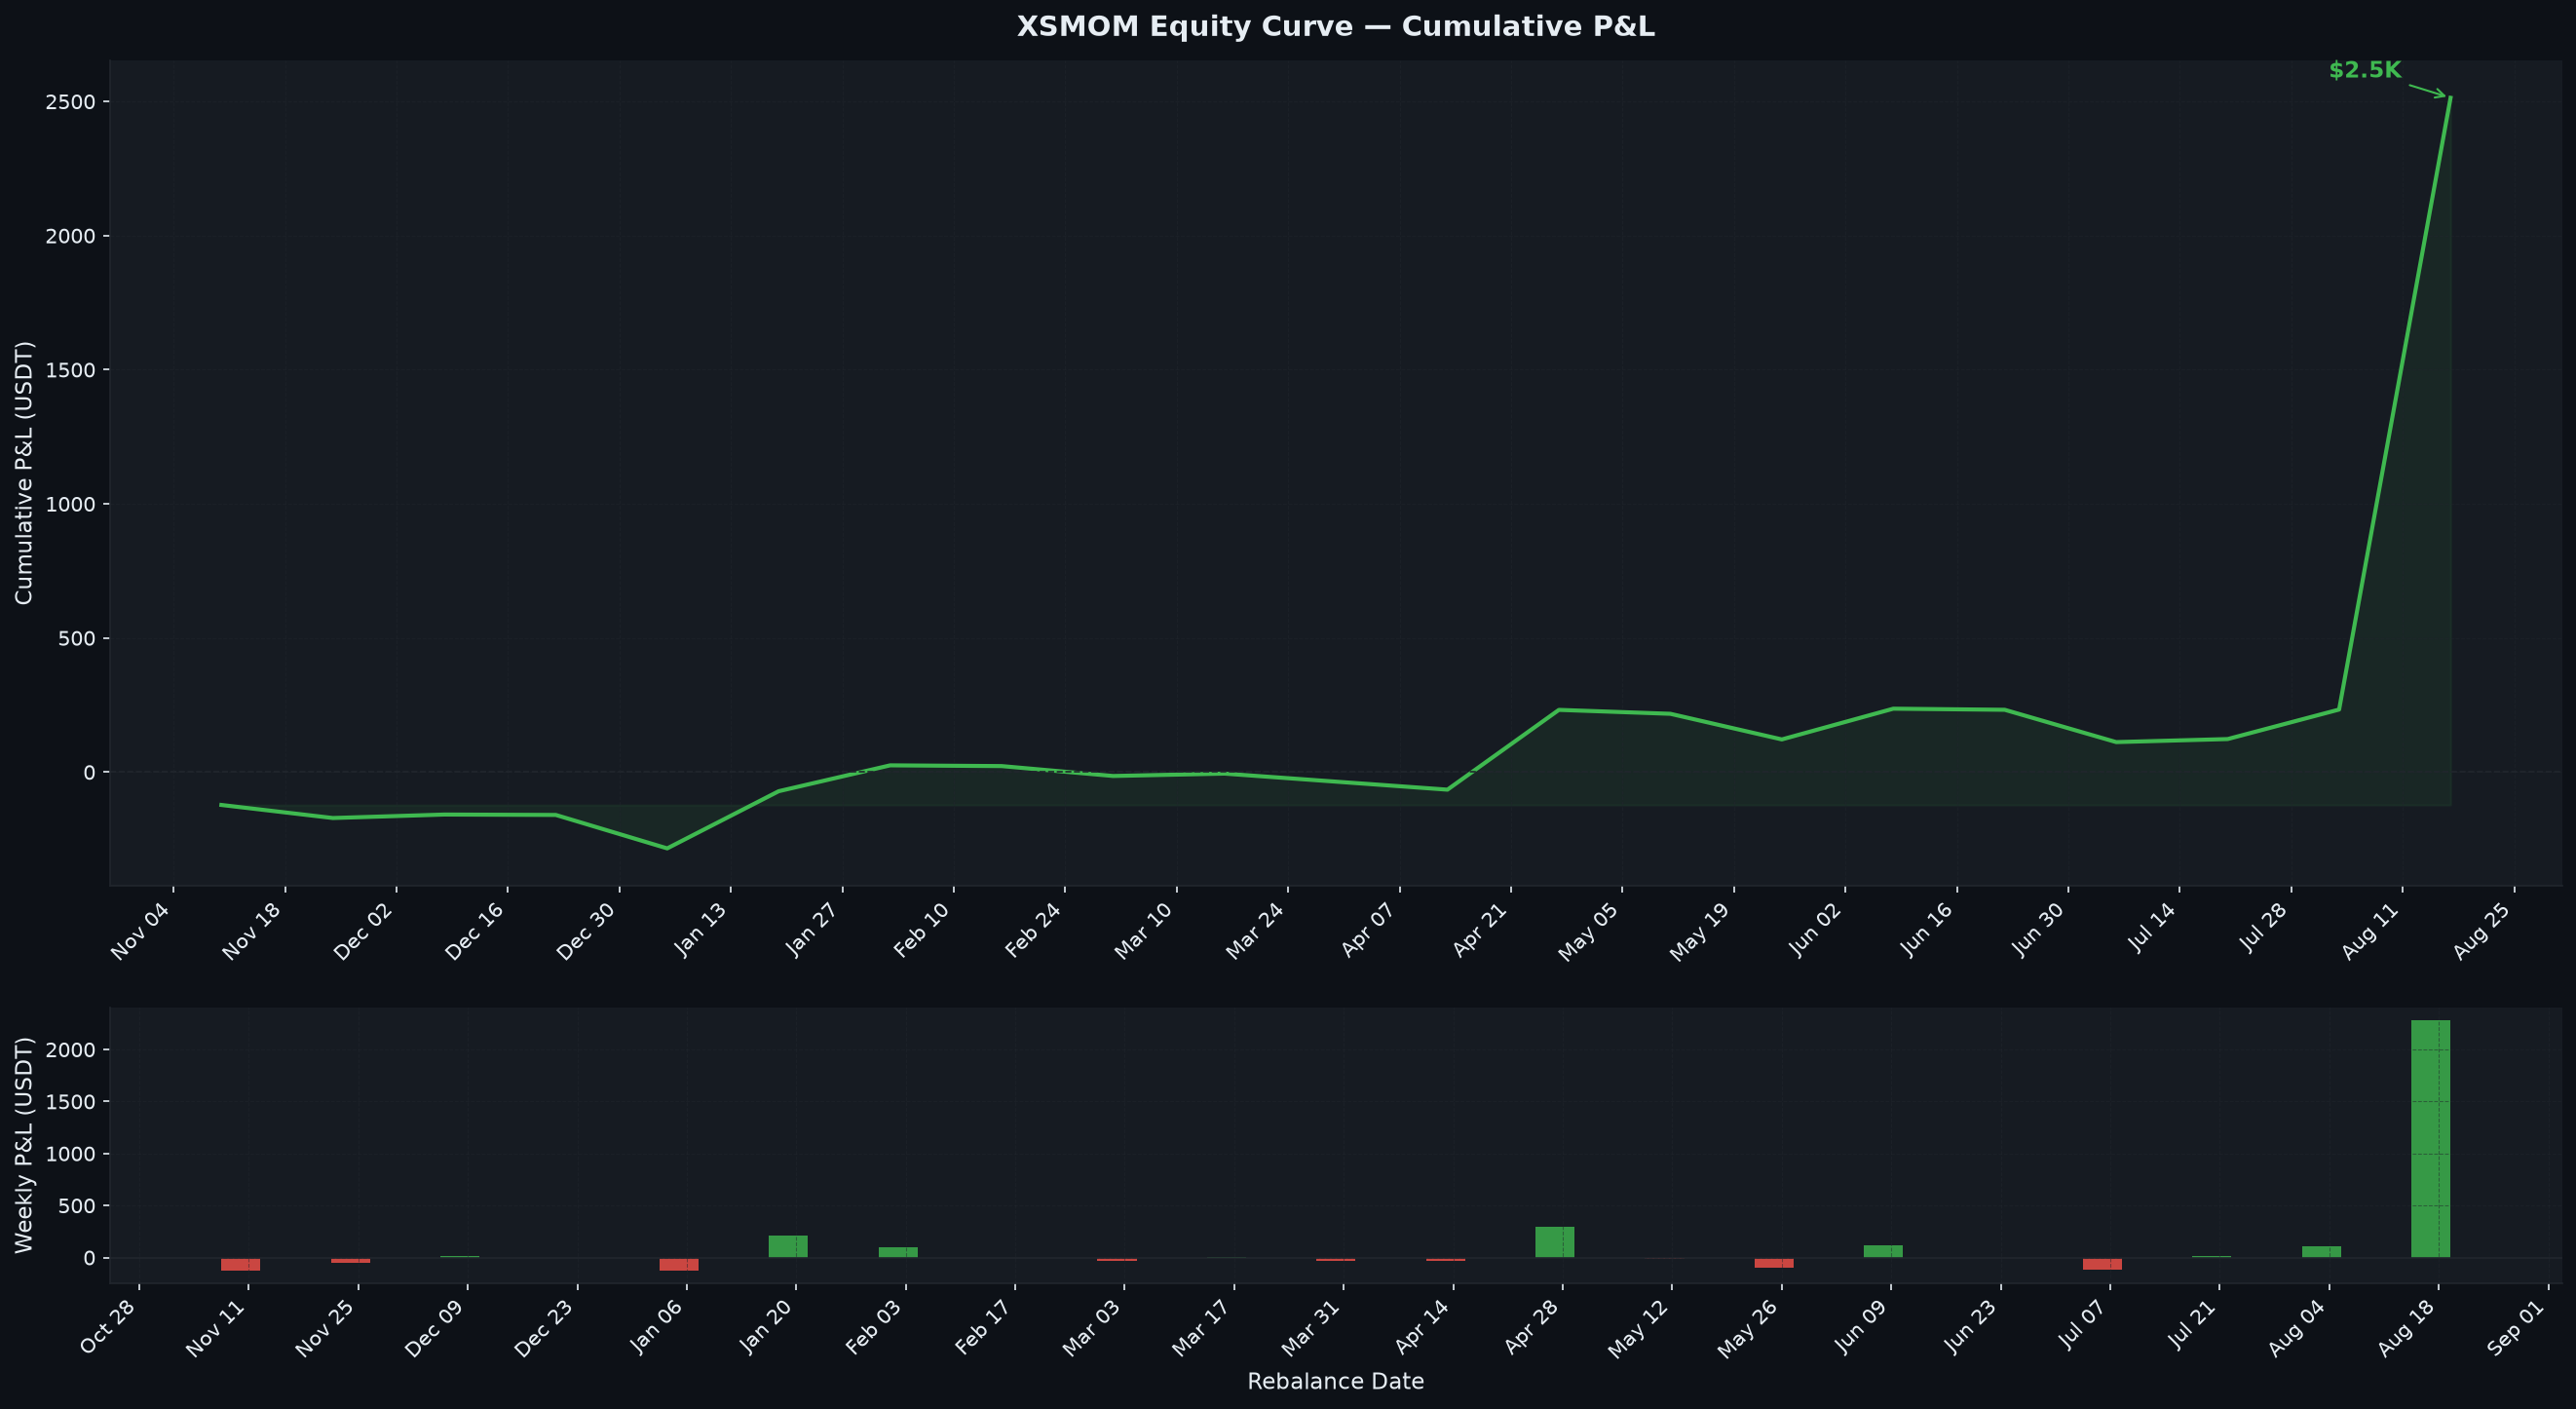
close > MA(100) and raw_return > 0. Only coins with genuine upward momentum qualify.VNR ≤ -0.5 (optimised floor). Important finding: with this floor, shorts rarely trigger in this sample — the optimised book is effectively long-only. When shorts are forced (no floor), they lose money over the full history (see Monte Carlo section).Backtest of the optimised configuration over 104 biweekly periods (15 Nov 2021 → 17 Aug 2026). Data: real Bybit daily OHLCV for the top-50 volume perps; deep history is paginated (~4 years where the contract allows), and the universe expands as newer perps accumulate enough history (33 → 49 symbols).
| Total P&L | +$6,371.26 |
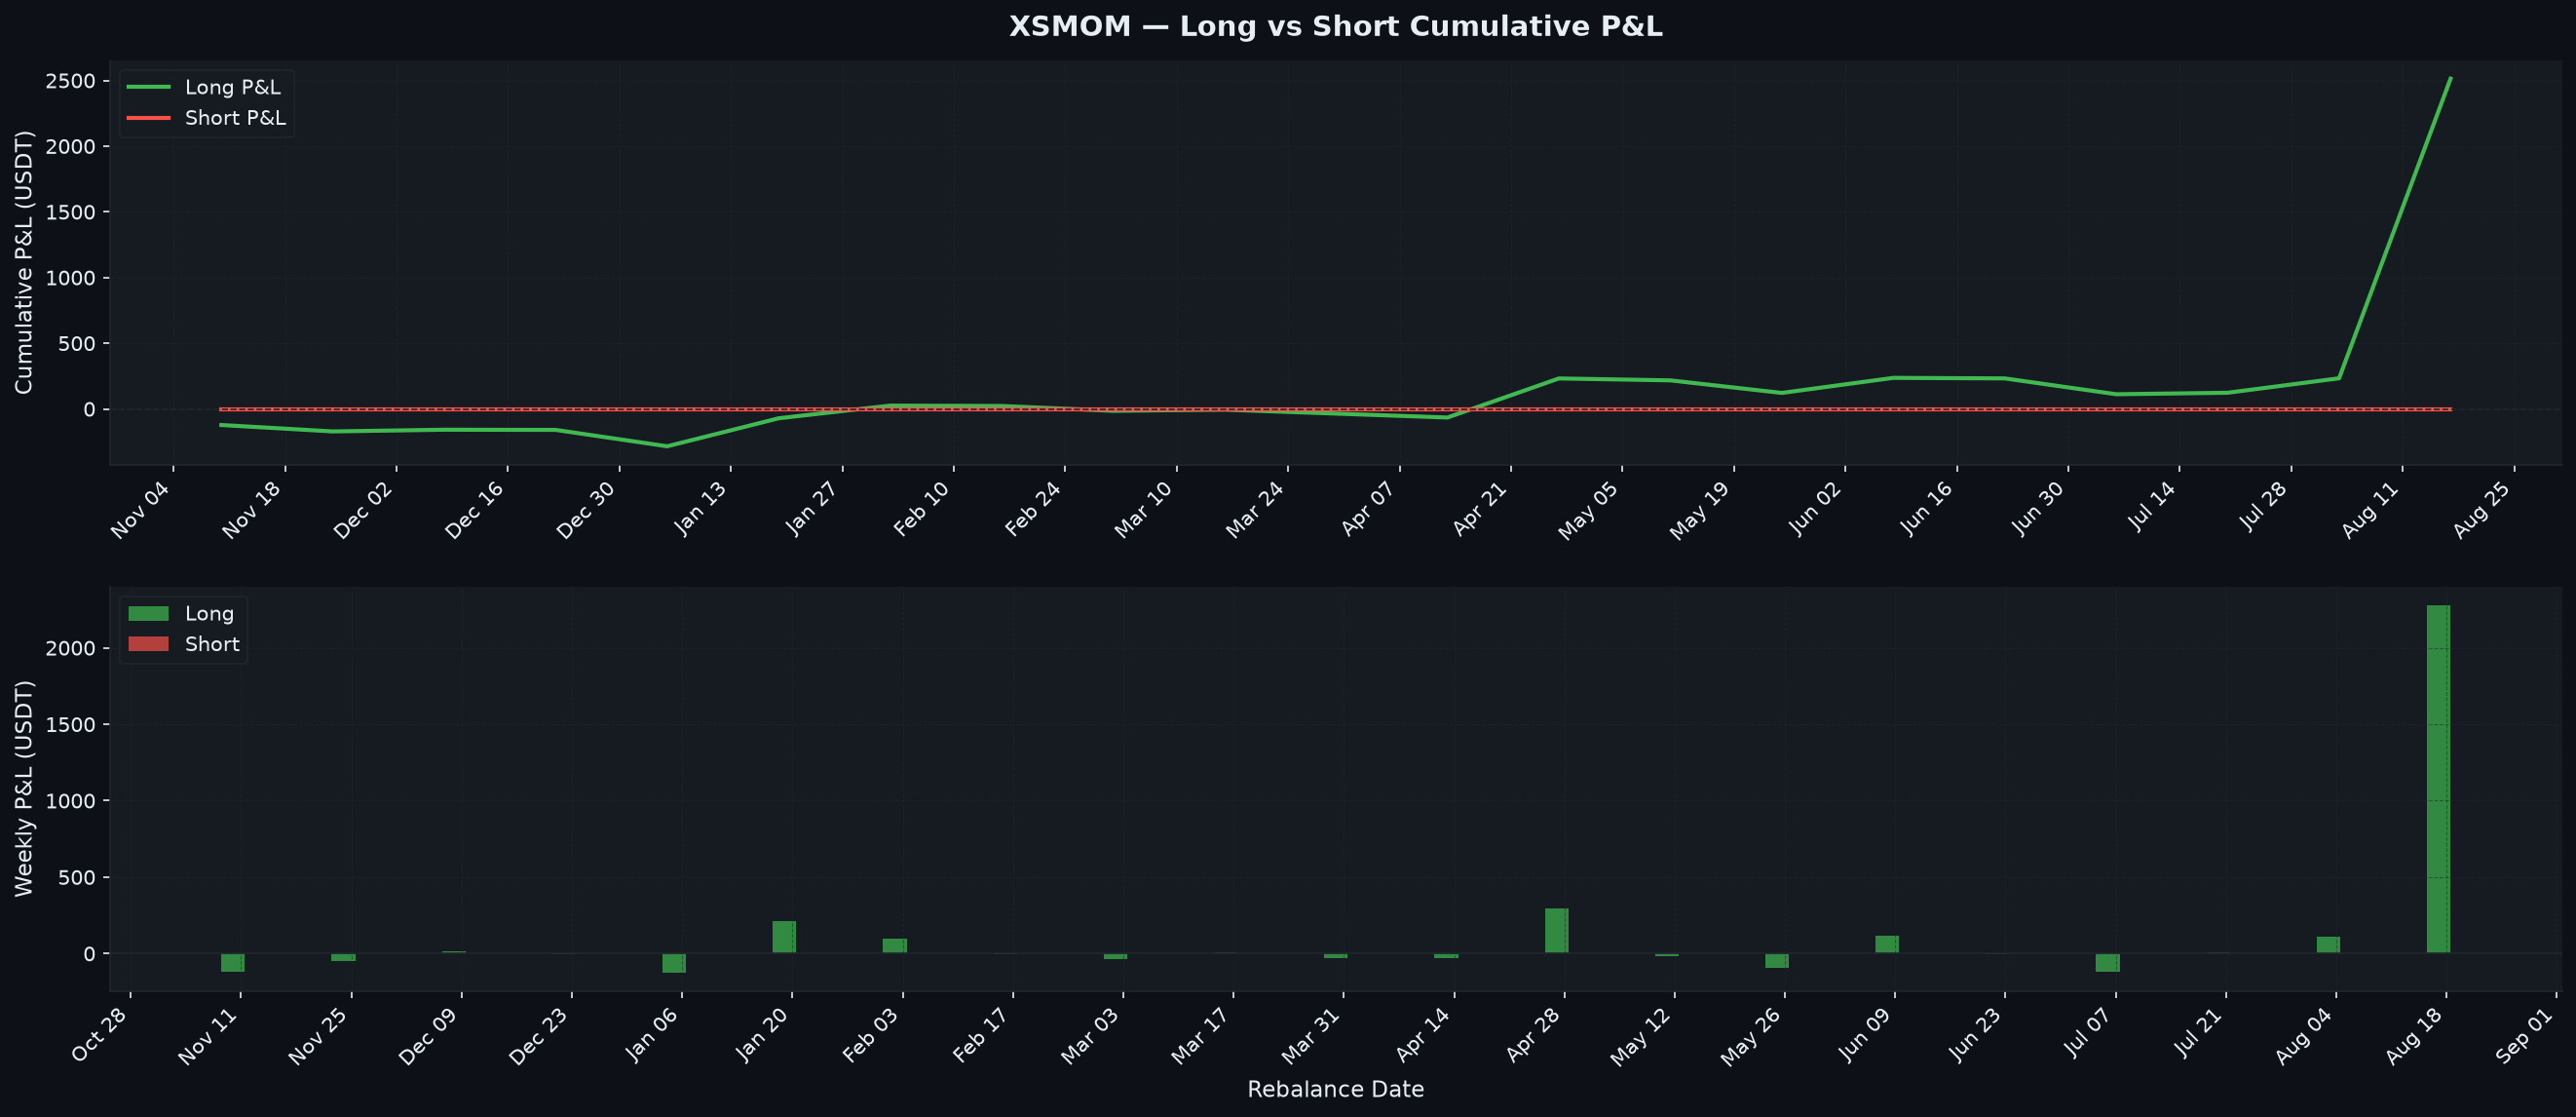
| Long P&L | +$6,373.31 |
| Short P&L | -$2.05 (1 trade — floor dormant) |
| Periods (biweekly) | 104 |
| Avg P&L / period | +$61.26 |
| Win rate (trades) | 34.2% (139W / 267L) |
| Avg win | +$73.34 |
| Avg loss | -$14.32 |
| Profit factor | 2.67 |
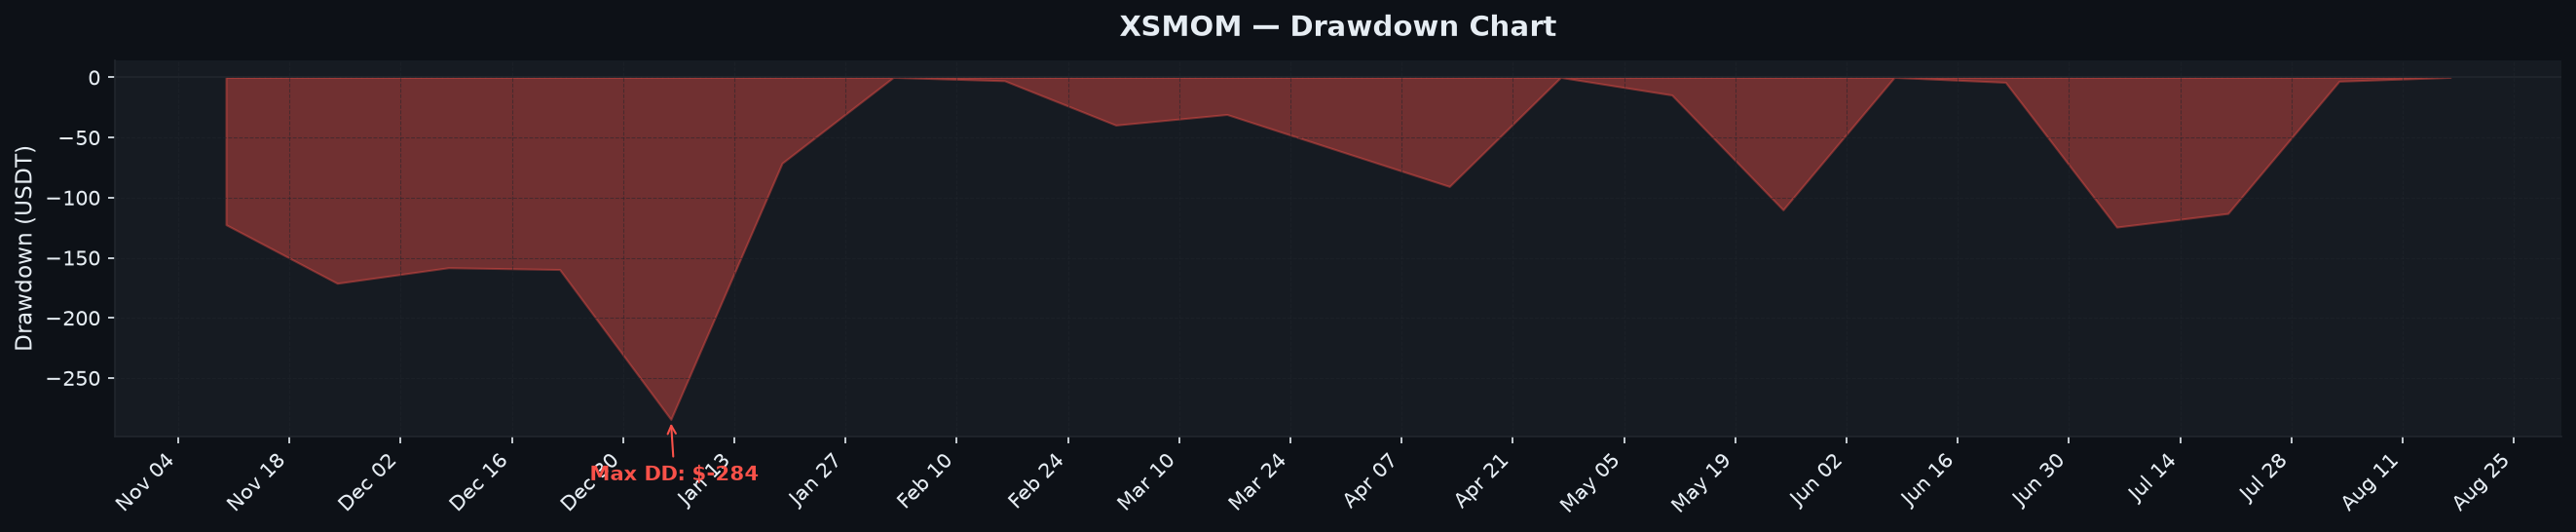
| Max drawdown | -$804.63 |
| Sharpe (weekly, 0% Rf) | 0.256 |
| Sharpe (annualised ×√26) | ≈1.30 |
| Total trades | 406 (all but 1 long) |
| Positive periods | 48 / 104 (46%) |
| Year | Periods | P&L | Pos. periods |
|---|---|---|---|
| 2021 | 3 | -$81.7 | 0/3 |
| 2022 | 14 | -$355.9 | 5/14 |
| 2023 | 23 | +$1,038.7 | 12/23 |
| 2024 | 24 | +$1,846.0 | 11/24 |
| 2025 | 23 | +$2,013.7 | 12/23 |
| 2026 | 17 | +$1,893.2 | 8/17 |
The strategy is a momentum book that needs a bid: it loses in the 2022 bear market and the 2021 sample, and compounds in 2023–2026. Expect underperformance in sustained downtrends — this is regime-dependent, not regime-neutral.
| Rebalance date | Universe | Longs | Shorts | Period P&L | Cumulative |
|---|
The headline P&L is only meaningful if it survives scrutiny. Two complementary tests: a jackknife (how dependent is the total on any single period?) and a 20,000-path moving-block bootstrap (what does the distribution of outcomes look like, preserving regime clustering?).
We remove each period in turn and recompute total P&L. The most influential periods:
| Period | P&L | % of total | Total without |
|---|---|---|---|
| 2026-08-17 | +$1,445 | 22.7% | +$4,926 |
| 2025-09-29 | +$1,288 | 20.2% | +$5,083 |
| 2024-10-28 | +$789 | 12.4% | +$5,582 |
| 2023-11-27 | +$498 | 7.8% | +$5,873 |
| 2023-10-16 | +$408 | 6.4% | +$5,963 |
The original 21-period backtest had a single week worth 91% of P&L. After extending to 104 periods, the best week is 22.7% — removing it leaves +$4,926, still strongly positive. No single period breaks the result.
20,000 simulated paths, each a resample of the period-return series in blocks of 3 (preserves short-run autocorrelation / regime clustering):
| Percentile | Total P&L | Weekly Sharpe |
|---|---|---|
| P5 | +$2,017 | 0.128 |
| P25 | +$3,886 | 0.203 |
| P50 (median) | +$5,381 | 0.250 |
| P75 | +$7,027 | 0.290 |
| P95 | +$9,559 | 0.355 |
Median path +$5,381 (close to the observed +$6,371); the entire P5→P95 range is positive. P(total > 0) = 99.8% across all 20,000 paths.
Median simulated max drawdown ≈ $546; P90 ≈ $852. Realistic expectation: the book will draw down $300–$850 at some point. Drawdowns are the cost of a 46%-positive momentum book with fat right-tail winners.
| Config | P&L | Sharpe | PF | MaxDD | Shorts |
|---|---|---|---|---|---|
| Optimised (OPT) | +$6,354 | 0.256 | 2.66 | -$805 | 1 |
| Long-only | +$6,422 | 0.252 | 2.61 | -$803 | 0 |
| As-designed L/S (no floor) | +$5,671 | 0.246 | 1.55 | -$486 | 750 |
| Original baseline (weekly/noSL) | +$5,875 | 0.231 | 1.93 | -$575 | 0 |
Four very different parameterisations all end positive over 4.75 years — the edge is not an artifact of one lucky config.
| Half | Periods | P&L | Sharpe | PF | MaxDD |
|---|---|---|---|---|---|
| First (2021–2023) | 52 | +$968 | 0.132 | 1.54 | -$805 |
| Second (2024–2026) | 52 | +$5,386 | 0.342 | 3.67 | -$284 |
The edge strengthened sharply in the second half (Sharpe 0.13 → 0.34). The first half includes the 2022 bear (where the book loses) and the early deep-history sample. This concentration is the honest caveat: the strategy's best years are the most recent ones, so forward-looking expectations should be anchored to the second-half economics, not the full-sample average.
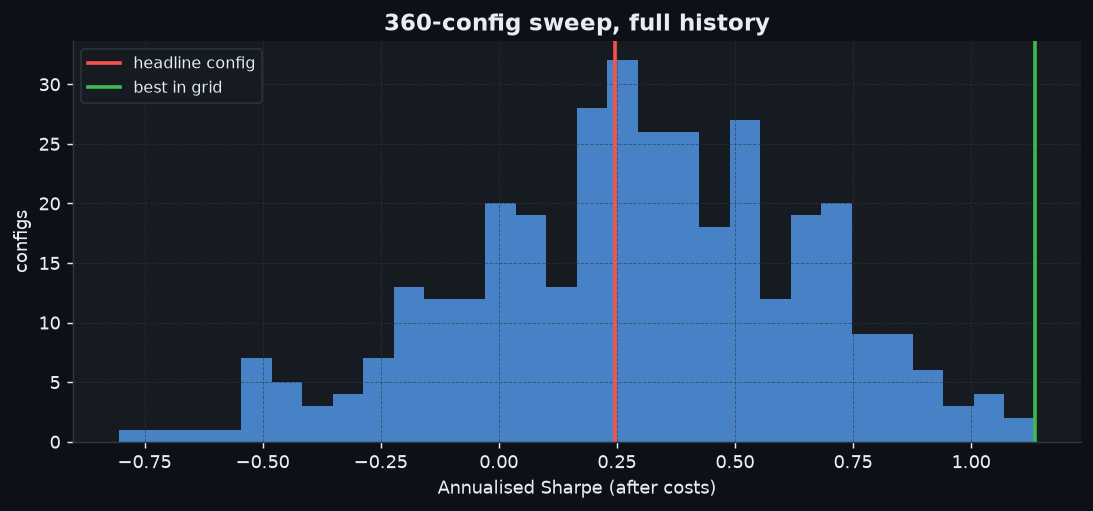
50+ configurations tested one dimension at a time against the baseline (30d VNR · MA=50 · weekly · 5L/5S · no stop · no short floor · ma+rawpos). Rankings by Sharpe. In-sample optimisation — results are optimistic; treat as directional, not as expected live performance. The extended-history numbers on this page come from the applied optimised config re-run over the full 104-period sample (the sweep itself ran on the first 24 weeks available).
| Schedule | P&L | Sharpe | PF |
|---|---|---|---|
| weekly (baseline) | +$409 | 0.182 | 1.23 |
| biweekly | +$3,815 | 0.328 | 2.53 |
Extending the hold from 7→14 days lets winners compound and cuts rebalance whipsaw. This leg ran without the short floor, so shorts were still active here.
| Stop | P&L | Sharpe | PF | MaxDD |
|---|---|---|---|---|
| none (baseline) | +$410 | 0.182 | 1.23 | -$180 |
| 15% | +$830 | 0.371 | 1.60 | -$126 |
| 25% | +$597 | 0.262 | 1.37 | -$170 |
15% is the single best Sharpe improvement: it caps catastrophic single-coin blow-ups while letting winners run.
| MA | P&L | Sharpe | PF |
|---|---|---|---|
| none (raw-pos only) | +$364 | 0.156 | 1.20 |
| 20 | +$355 | 0.150 | 1.19 |
| 50 (baseline) | +$411 | 0.183 | 1.23 |
| 100 | +$525 | 0.221 | 1.32 |
| 200 | +$289 | 0.146 | 1.21 |
MA=100 is the sweet spot — a slower regime filter that rejects more false-positive longs in chop.
| Floor | P&L | Sharpe | PF | Trades |
|---|---|---|---|---|
| none (baseline) | +$410 | 0.182 | 1.23 | 239 |
| -0.3 | +$498 | 0.198 | 1.38 | 167 |
| -0.5 | +$555 | 0.199 | 1.49 | 119 |
| -0.75 | +$555 | 0.199 | 1.49 | 119 |
| -1.0 | +$555 | 0.199 | 1.49 | 119 |
The floor improves PF by culling weak/mean-reverting shorts — but note the robustness finding: over the full 4.75y sample, forcing shorts on (no floor) is a net drag (-$205 over 750 trades). The floor's value is largely "don't short at all."
| Window | P&L | Sharpe | MaxDD |
|---|---|---|---|
| 14 | +$472 | 0.144 | -$510 |
| 21 | +$48 | 0.019 | -$180 |
| 30 (baseline) | +$412 | 0.183 | -$178 |
| 45 | +$117 | 0.040 | -$329 |
| 60 | -$137 | -0.058 | -$272 |
30 days has the best Sharpe / drawdown balance. 14d has higher raw P&L but 2.9× the drawdown.
| Config | P&L | Sharpe |
|---|---|---|
| 3L/3S | +$287 | 0.194 |
| 5L/5S (baseline) | +$410 | 0.182 |
| 7L/7S | +$667 | 0.193 |
| cap 50% / 40% / 30% | +$393 / +$393 / +$387 | ≈0.177 / 0.175 |
Concentration caps hurt: signal-proportional sizing is an alpha source, not a risk bug.
| Config | P&L | Sharpe | WR | PF |
|---|---|---|---|---|
| Baseline (30d/MA50/weekly) | +$410 | 0.182 | 45.6% | 1.23 |
| Best-of-each-dimension (30d/MA100/biweekly/15%SL/floor-0.5) | +$2,488 | 0.285 | 41.2% | 2.43 |
| Applied optimised config (re-run over 104 periods) | +$6,371 | 0.256 | 34.2% | 2.67 |
Full 50-row sweep data available at sweep_data.json in this repo.
Pure-Python, stdlib-only backtest (no pandas/numpy). Fetches real data from the Bybit V5 public REST API, paginating for deep history, and caches it locally.
MOMSXperp/
├── config.py # strategy parameters (optimised)
├── run.py # backtest entry point
├── analysis.py # ranking, selection, sizing, P&L engine
├── fetch.py # Bybit V5 OHLCV fetch + paginated deep history
├── refetch_deep.py # re-fetch deep history for all symbols
├── report.py # extended diagnostics
├── charts.py # matplotlib equity/side/drawdown charts
├── sweep.py # 8-dimension parameter sweep
├── montecarlo.py # jackknife + block-bootstrap robustness
├── robustness.py # multi-config matrix + walk-forward split
├── xsmom_results.json # optimised backtest (104 periods)
├── xsmom_mc_results.json # Monte Carlo output
├── xsmom_robustness.json # robustness matrix
├── xsmom_sweep_results.json # full sweep output
└── site/ # this Cloudflare Pages site
└── assets/ # charts
# backtest (cached data; --force to re-fetch deep history)
python3 -m xsmom.run
# deep re-fetch of all symbols (one-time)
python3 -m xsmom.refetch_deep
# Monte Carlo robustness (20k paths)
python3 -m xsmom.montecarlo
# multi-config robustness matrix + walk-forward
python3 -m xsmom.robustness
# extended diagnostics / charts
python3 -m xsmom.report
python3 -m xsmom.charts
# full parameter sweep (2-3 min)
python3 -m xsmom.sweep
Data is cached under xsmom/data_cache/ so repeat runs are instant. No API key required for public market data.
fetch.py pages backwards with the end timestamp to reach ~4 years where the contract allows (majors back to 2020–2021; newly-listed perps have less). This extended the backtest from 21 → 104 periods.Read this before acting on anything on this page. This is what a critical reviewer should weigh.
Everything is open for review. Clone, re-run, and challenge the numbers.
xsmom_results.json — full optimised backtest (104 periods, per-trade detail).xsmom_mc_results.json — Monte Carlo: jackknife + 20k-path bootstrap.xsmom_robustness.json — 4-config robustness matrix + walk-forward split.xsmom_sweep_results.json — all 50 sweep configurations with weekly P&L series.sweep_data.json — condensed sweep tables used to build this page.config.py — the exact optimised parameter set.